Posts Tagged ‘Profiling’
Profiling a Windows Service
You need to do a little bit extra to profile a service, if you get “VSPerfCLREnv was not set up correctly” solution is here.
This “howto” has been written for a really simple service, wich you can download. It’s tiny so you can isolate the “how do i” from the “for my service”.
To quickly start do this:
run “VSPerfCLREnv.cmd /globalsampleon” this cmd is located in “Team Tools\Performance Tools”(Vs2008/vs2010) install folder, for me that is : “C:\Program Files\Microsoft Visual Studio 9.0\Team Tools\Performance Tools\” . This will be “C:\Program Files\Microsoft Visual Studio 10.0\Team Tools\Performance Tools\” for vs2010.
If your Service starts at startup, reboot, else stop and start your service. I booted just to be sure.
Open your “windows service” project in Visual Studio.
When you are using my sample do this:
Compile solution (this installs the service and starts the service, see: “build event”)
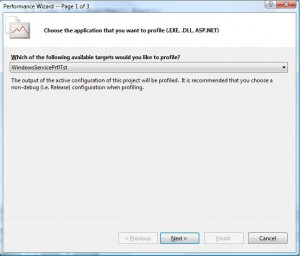
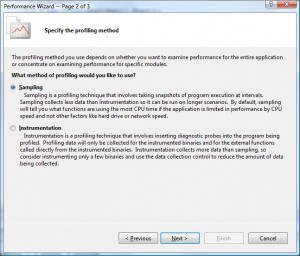
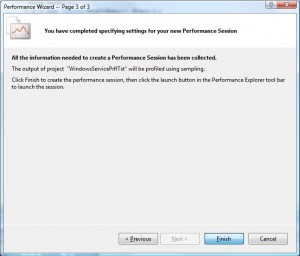
Start Wizzard : Analyze > Launch Performance Wizzard , select “sampling” and finish.
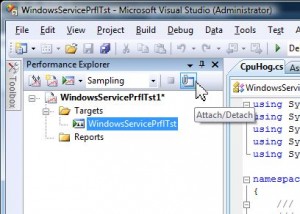
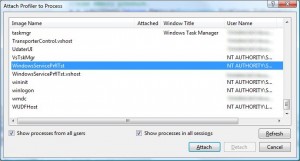
Now you can’t “Launch with Profiling” (you can’t start a service directly), you need to “Attach” to it, find your service process. Check the “Show processes from all users” and “Show processes in all sessions“.
Run it as long as you wish until you are done. Press stop and you’ll receive report which you can drill down into.
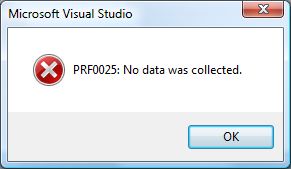
Now in real live applications your service might not be a hog for cpu cycles. So you might get an error that “No Data was Collected“.
This could happen:
- You did not attach to correct process!
- Your app does so little, when the profiler does some sampeling your service is idle and therfore invisible to the profiler
Finally:
When you are done with profiling call “VSPerfCLREnv.cmd” /globaloff” this will disable profiling and give you back those cpu cycles otherwise used for profiling.
